Do your reports demonstrate real business value? More and more agencies these days have expressed to us a desire to start showing their clients more value-based metrics as opposed to feel-good metrics. Value-Based vs. Feel-Good Metrics What do we mean … Read More
-
Testimonials
"Deftly's intuitive interface makes it easy to automate our reporting and create stunning visuals without much training and no coding required. Their support is extremely responsive, usually resolving questions within half an hour. Deftly is saving us dozens of man hours, and freeing up people to do more billable work."
-CJ Pomerantz, Caliber group -
Testimonials
"We've been trying to get one of our clients to approve new services for years. It wasn't until we showed them the data combined with storytelling in Deftly that they finally listened and approved the new work! We're also getting new prospective clients that say they need solid reporting in order to work with us, and now we can show it to them before they even become our clients."
-Patricia Birchenough, Hunterdon Business Services -
Testimonials
"We went through weeks of testing various tools but Deftly was the only one that had the right features, cost, and usability. During the Free Trial, our Deftly account representative was able to take our spreadsheets which contained all of the metrics we wanted to show our clients, and transform it into a much more visual client-friendly presentation that highlights our most valuable insights."
-Devon Vocke, Evoke Strategy
Sync
Centralize data in one place: website analytics, social media, paid search, SEO, email marketing, or data from any spreadsheet.

Data Integrations


Customize
Choose your most important metrics from the data sources you synced. Mix and match into the same charts, and add context to tell a story.
Deliver
Automatic notification emails, share links, and high-quality PDF export provide flexible delivery options.

Does Deftly align with your process? Schedule a demo now to find out!
Today you need more than a dashboard
Metrics only matter if your clients or stakeholders can understand the story behind them.
Interactive Presentation Format
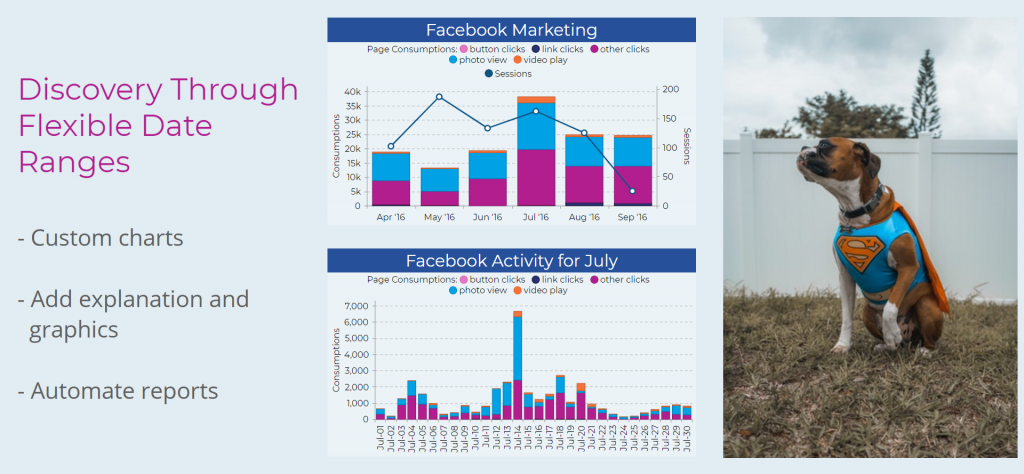
Engage your audience with an interactive presentation-style format, that allows you to combine real-time analytics with text and graphics to create a story that adds real business-context to your data. Then, deliver your report as an interactive web experience or as a high-quality PDF.
Flexible Data
Pull data from multiple channels, including website analytics, SEO, PPC ad data, social media engagement, email marketing, leads and sales spreadsheet data and more. Choose and combine fields, overlay different data sources, use comparison periods, and add filters to create views that demonstrate actual business performance.
Manage Multiple Brands
Create separate environments to keep all of your reports organized by brand. This ensures data security and permissioned access for each client/company.
Your Branding
Brand the entire portal with your own logo and colors. Individual storyboard reports can also each be branded with your and/or their own images and colors to create a personal feel.
Want to learn more about the capabilities?
Frequently Asked Questions
Deftly is a SaaS reporting platform that provides a web-based portal in which you can create Storyboards that sync and present live data from multiple integrations.
A Storyboard is a multi-page customized presentation with a familiar feel. You can add text and images and choose their placement, but you can also create visual charts or tables that sync real-time and/or historical data from multiple live sources. Storyboards can be edited by multiple people, copied, and shared.
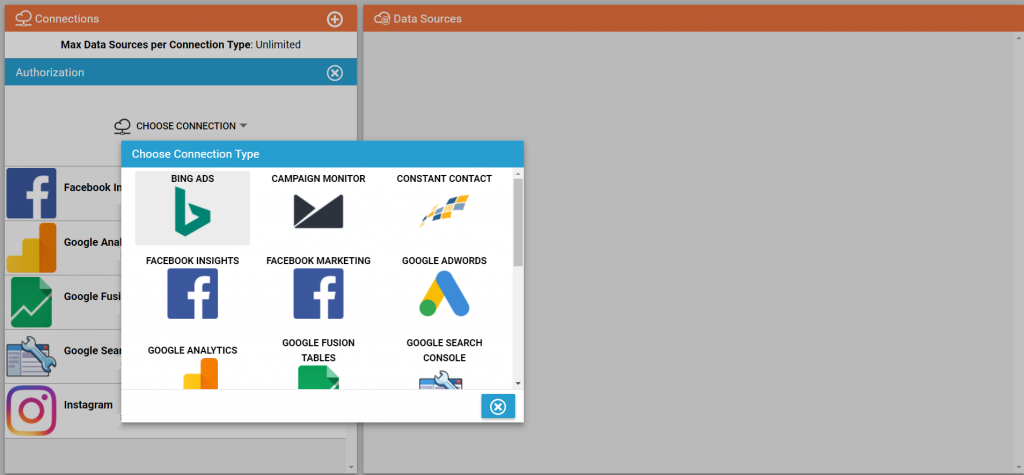
Authorizing one of your data integrations to send data into Deftly is simple. All you need to do is be logged in to the appropriate account from which you wish to pull data and then click to authorize the integration from within Deftly. You will be directed to click “Authorize” in your desired account and then you will be directed back to Deftly to select the appropriate page/s or campaigns from that account.
We’d be happy to look into any specific data integrations that are vital for you. In fact, that’s exactly how our list of integrations continues to grow. Please mention the integration during your demo when our representative asks.
Nothing at all. In fact, you can create dashboard views in Deftly which are extremely useful for internal tracking and trending. We simply find that dashboards don’t offer enough context and explanation when it comes to presenting data to clients or your internal stakeholders. Deftly seeks to create an engaging presentation with essential data alongside context to understand it, instead of a pile of charts that needs to be explained again and again. Deftly will track who is opening the Storyboards and how often, which is a starting point to understand your clients or stakeholders and what they’re really interested in seeing.
Absolutely! After seeing a demo, you’ll be invited to set up an introductory Free Trial session where we assist in setting you up with your own portal, and syncing your own data sources within minutes. We’ll then provide you with a template so you can instantly see what a fully completed Storyboard looks like with your own data synced in! That template can be easily edited and copied over to any other company, or we can even show you how to create your own Storyboard from scratch.
Submit a form through our website and you will be contacted to schedule a demo right away!
What are Assisted Conversions and Why Do They Matter?
Posted by Evan Magor
Let’s say someone clicks on a Google Ad that directs them to your client’s website. The visitor takes a look at the website but doesn’t purchase anything and closes their browser. The next day, however, that same visitor types in … Read More
Featured Post
What Data Should Go Into a Digital Marketing Report?
Posted by Evan Magor
When you’re responsible for tracking so many digital marketing metrics, there’s always going to be the million dollar question hanging over your head: “What data should go in my report?” Today, we’re tuning in to an article written by agency … Read More
Featured Post


